How to configure the dashboard webpart?
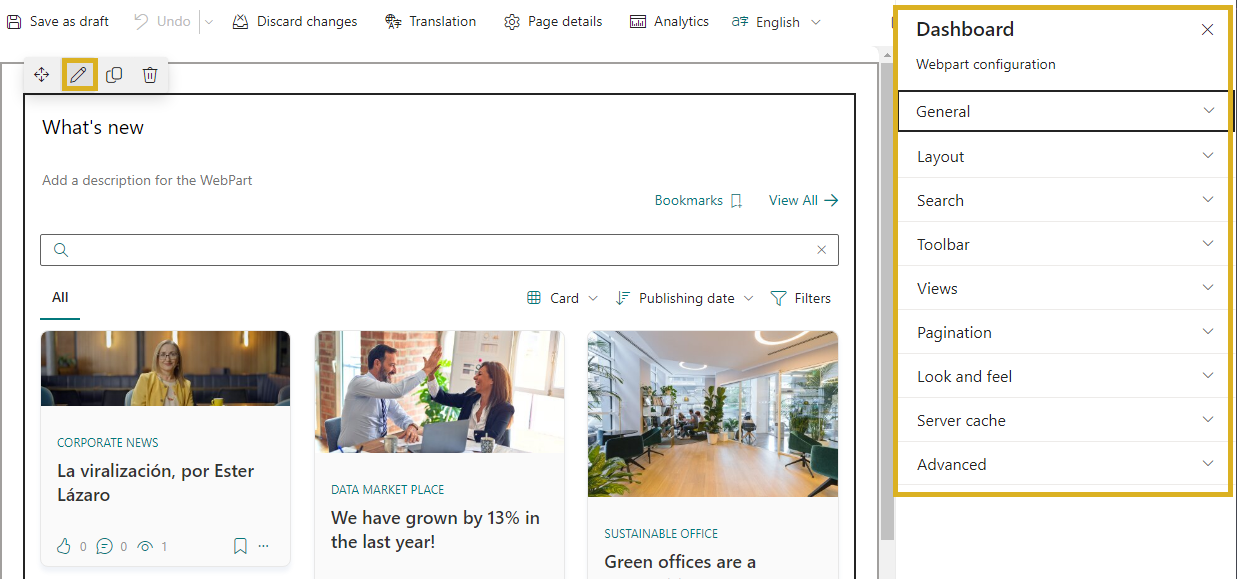
To configure the dashboard, add it to a page and open the edit mode. Click the edit action at the top left of the dashboard to access the configuration panel on the right side of the screen. From there, you will be able to configure all the properties available.
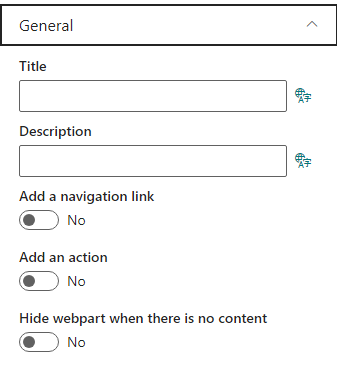
1. General
In this section, you will discover how to alter the title and description, incorporate a navigation link and action, and determine whether to hide the dashboard when no content is available for display.
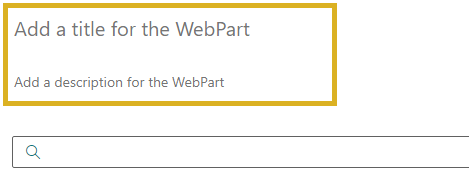
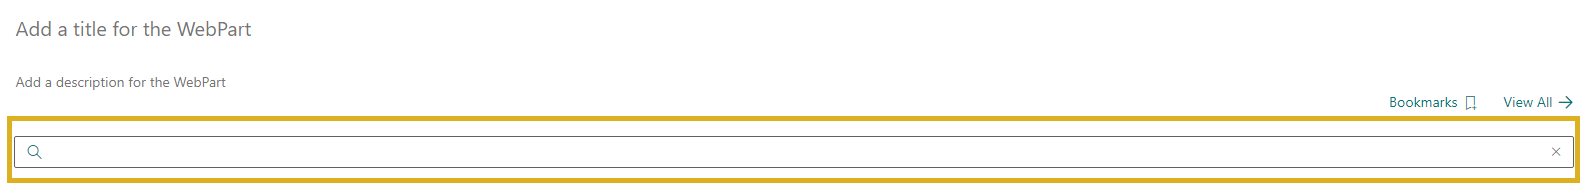
Title and Description
You can configure the text and description by simply filling in the available fields with the desired text. Both can be customized when the page is in edit mode. If you leave the title or description fields blank, no default text will be displayed.
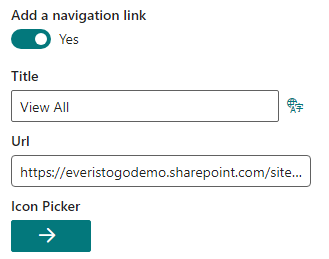
Adding a Navigation Link to the Dashboard Header
You can add a navigation link that will be shown at the top right of the dashboard. To enable it, switch on the option and fill in the required details, including a title and the URL for user redirection. You can also choose an icon from the provided list by clicking the “Icon” button. After setup, the link will be visible on the right side of the dashboard header.
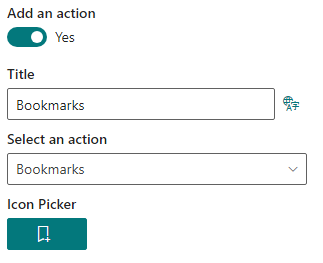
Adding an Action to the Dashboard Header
Just like adding a navigation link, you can also include an action. The setup is similar to a navigation link, but instead of providing a URL, you choose an action. This action will open a panel with options such as Favorites, Bookmarks, Applications, Drafts, Feedback, or Activity.
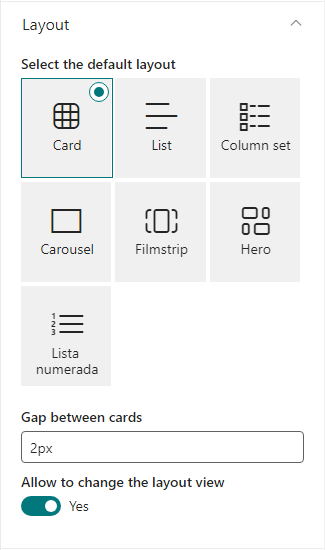
2. Layout
In this section, you can choose how your dashboard content is displayed by selecting a default layout. You have the following options:
- Card
- List
- Column set
- Carousel
- Filmstrip
- Hero
- Numbered list
Additionally, you can adjust the spacing between cards and decide whether users can change the layout from the dashboard toolbar.
3. Search
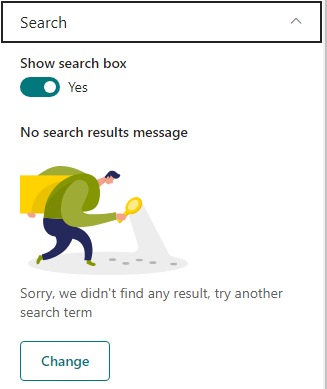
In this section, you can manage every aspect of the dashboard search feature. You can:
- Decide whether to show the dashboard search box.
- Customize the message and image displayed when no content is found. Click the “Change” button to input your preferred text and image in the provided fields.
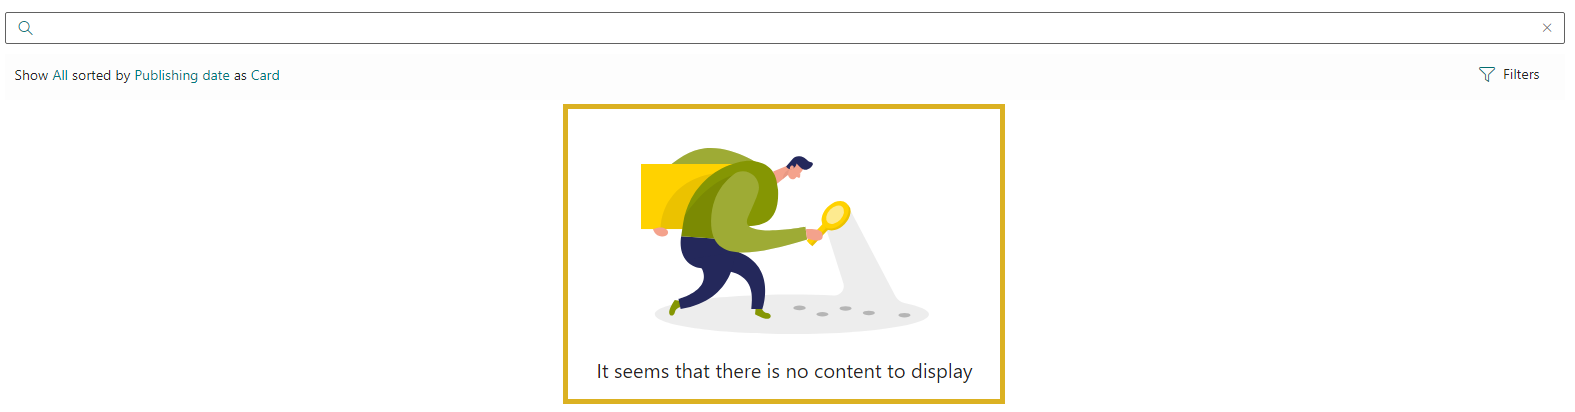
These options grant you complete control over the functionality and user experience of the dashboard search.
4. Toolbar
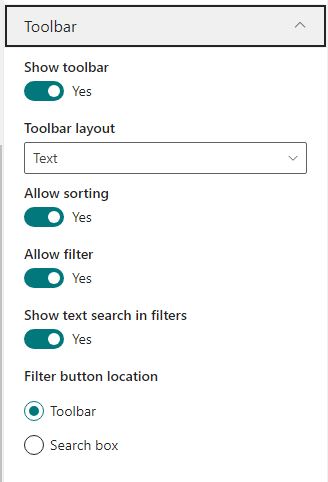
You can customize the configuration of the dashboard toolbar with the following options:
- Toggle the visibility of the toolbar on or off.
- Choose between two layout styles: Tabs (display custom views as tabs and provides sections to change the layout and sorting) or Text (includes a textual description of the filter allowing changes by clicking on highlighted text).
- Decide whether sorting functionality is allowed.
- Determine whether to enable filters.
- Choose text, icon, or both for the filter button.
- Select the filter button placement: within the toolbar or integrated with the search box.

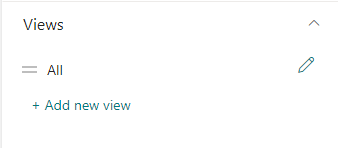
5. Views
In this section, you can oversee your dashboard views by adding, modifying, or deleting them. These views offer extensive parameterization options, allowing users to create highly customizable queries for a variety of content roll-up scenarios. For details on configuring a view, visit this link:
6. Pagination
The pagination section offers various configuration options: you can set the number of elements per page using the slider. If pagination is off, this number represents the total contents in the dashboard.
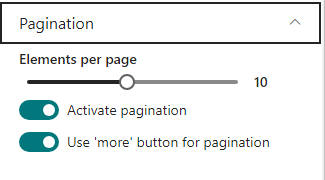
When pagination is on:
- If “Use more button for pagination” is disabled, it uses infinite scroll. Suitable when the dashboard is the sole or last element on the page with no columns.
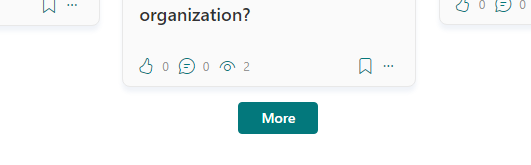
- If “Use more button for pagination” is enabled, a “More” button is displayed, suitable for all scenarios.
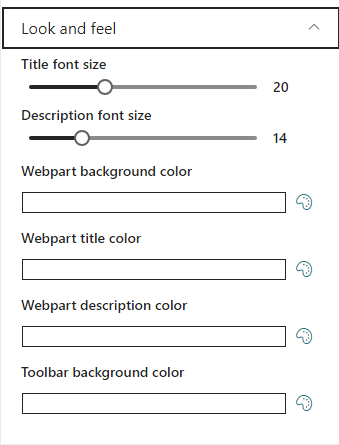
7. Look and feel
In this section, you easily can:
- Change the font size of the title and description.
- Modify the background color of the web part, toolbar, title, and description.
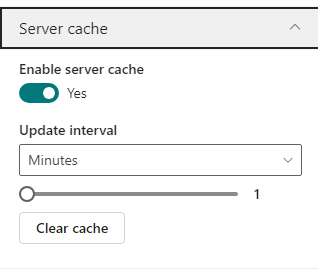
8. Server cache
You can turn on server caching for the dashboard content and choose how long the content should be stored in the cache, with time intervals available in minutes, hours, and days.
There is also a “Clear cache” button that lets you manually refresh the server cache. When you clear the cache, everyone accessing the dashboard will see the latest content, and it will be cached again for the duration you set.
Enabling server cache is a useful feature, especially for dashboards that do not need real-time data and can gain better performance through caching.
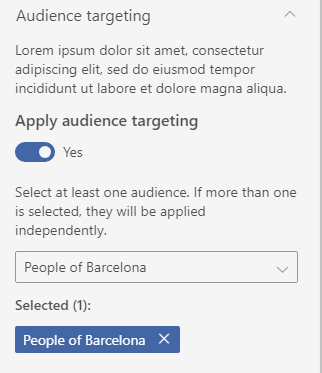
9. Audience targeting
In this section, you can decide if you want to use audience targeting. If you choose this option, the web part will only show up for people who are part of the selected groups. To pick these groups, a menu will appear, and you can select which audience(s) should see this web part. This helps make sure the web part is seen by the right audience, making your content delivery more accurate and personalized.
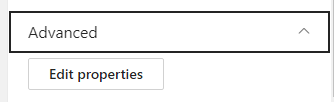
10. Advanced
In this section, experienced users can control all web part properties using a configuration JSON, allowing for advanced editing and a high level of customization.