Analytics
Audience: This article is intended for community owners
Syntphony incorporates an analytics tool to measure both the impact of the technological solution and the use that users make of the platform, through an external Power BI portal.
What information do analytics show?
The information displayed by Power BI is distributed in 5 main blocks:
- Engagement
- Interest
- Activity
- Active Users
- Search
Engagement
The first tab, called Overview, shows a dashboard with Engagement data calculated as a percentage based on previously set KPIs. The time span you want to measure is easily configurable via the selector at the top of the dashboard with years and months.
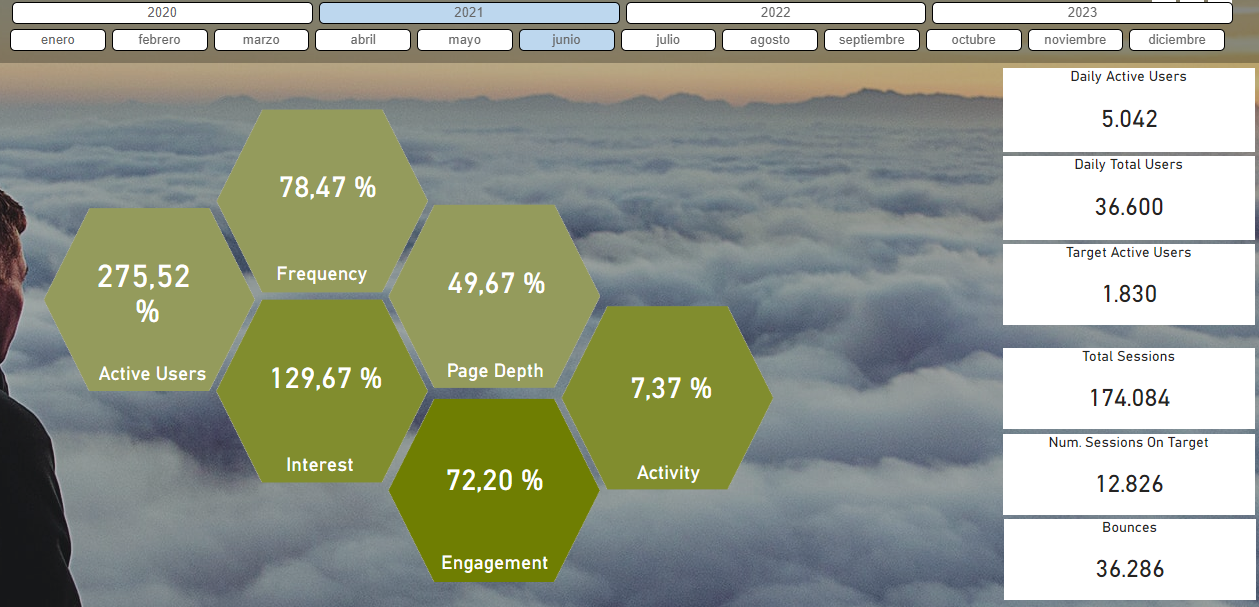
This dashboard shows the following metrics:
- Active users: this data shows, as a percentage, the number of users accessing the portal based on the predicted values defined previously.
- Frequency: this data shows, as a percentage, the number of sessions per user per day achieved based on the previously defined values.
- Page Depth: this data shows, as a percentage, the number of pages visited in a single session achieved based on the previously defined values.
- Interest: this data shows, as a percentage, the users interest based on the active users, frequency and page Depth.
- Engagement: this data is the arithmetic mean of the interest and activity and shows the engagement level of Syntphony users.
- Activity: this data shows, as a percentage, the sessions that provide quality according to a previously established and fully configurable score. The aspects involved in the scoring are content views and social actions.
These metrics are clickable, allowing you to learn more about them.
The same metrics are shown on the side of the panel but expressed in numerical not percentage format.
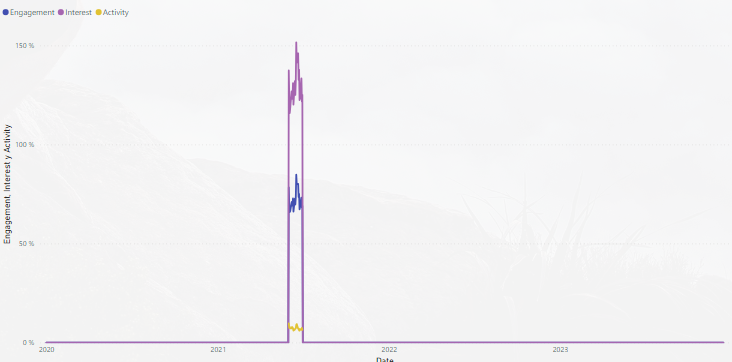
The timeline graphically shows engagement, interest and activity over time.
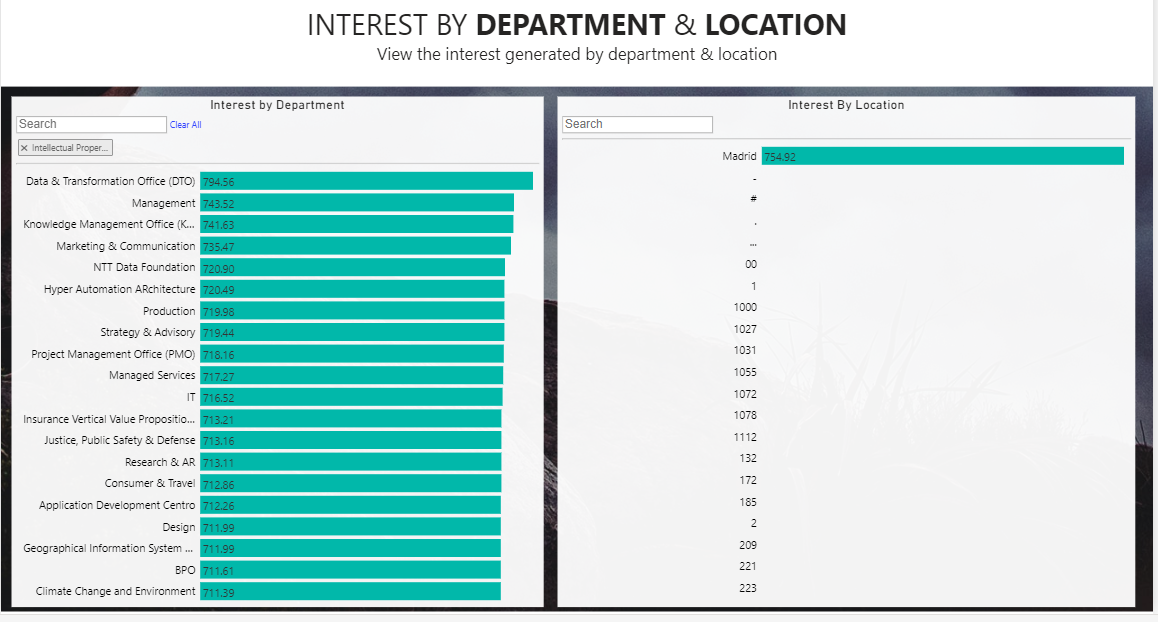
Interest
The interest dashboard shows data about active users, frequency and page depth broken down by the time period you want to measure.
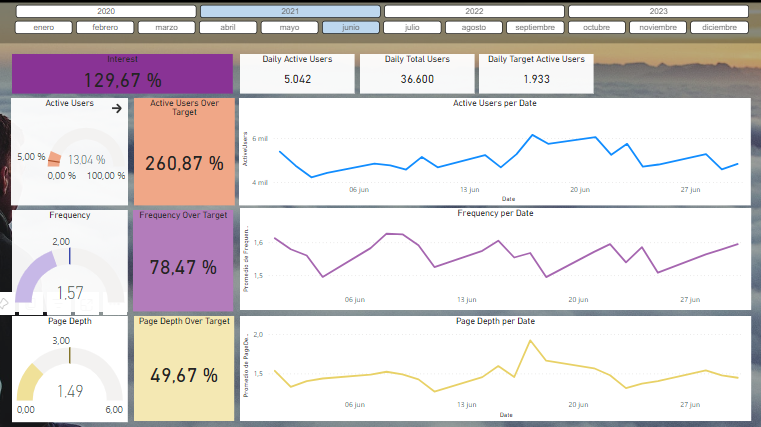
In addition, these metrics can be filtered according to the department and location to which users belong.
Active users
The active users dashboard shows information on the number of users accessing the portal.
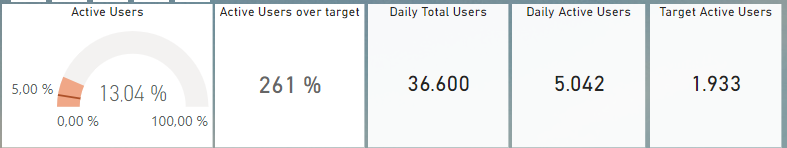
Allows filtering by department and location to which users belong
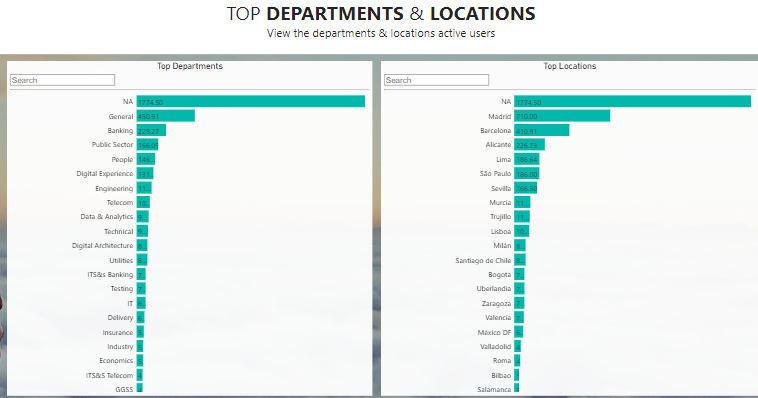
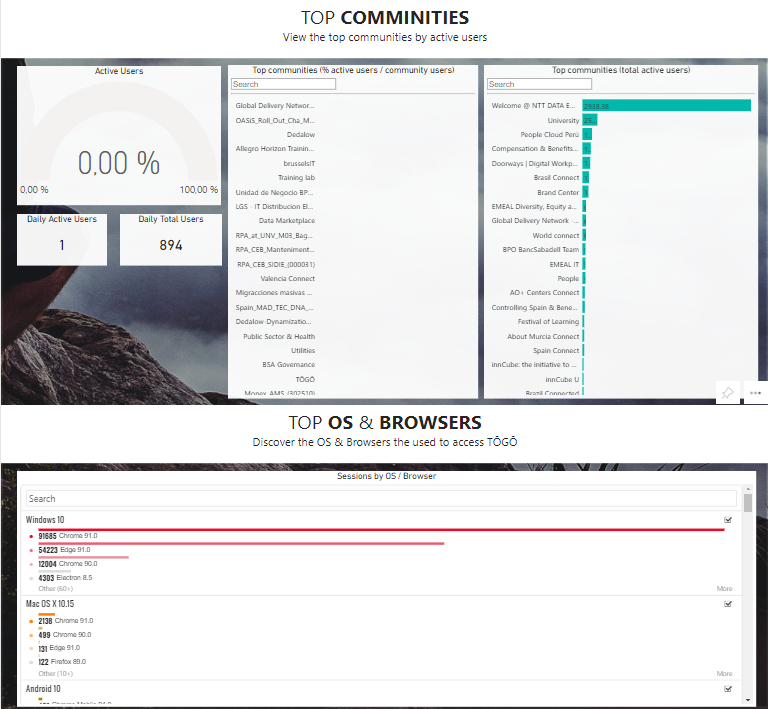
As well as the communities most accessed by users and the operating system and browser from which they access Syntphony
Activity
The “activity” dashboard shows two main elements: the bounce rate and the target session. The administrator can configure what he considers to be a standard ideal session, based on the views and social actions that a user should perform in Syntphony, thus obtaining his session on target.
Through the Activity panel you can see the number of sessions in relation to the number of sessions on target and the number of sessions and bounces.
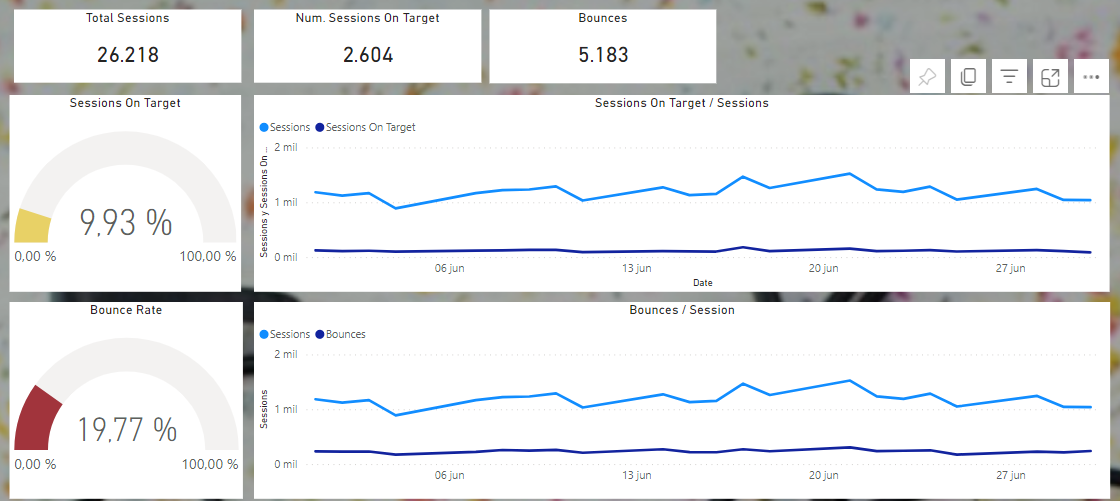
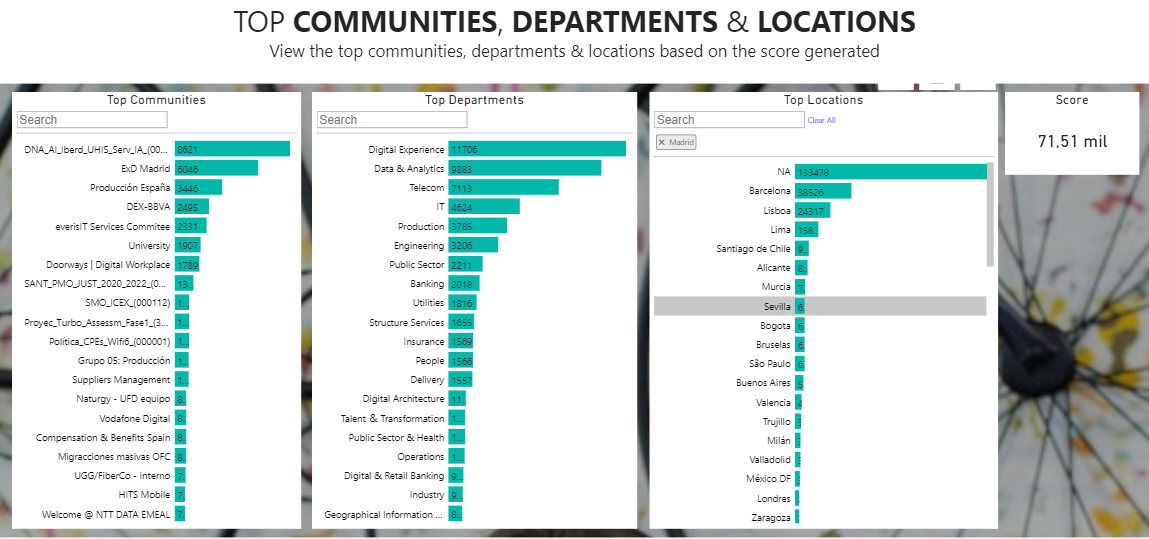
As with the previous metrics, activity can be filtered according to the departments and location to which the user belongs and the communities to which the user most accesses.
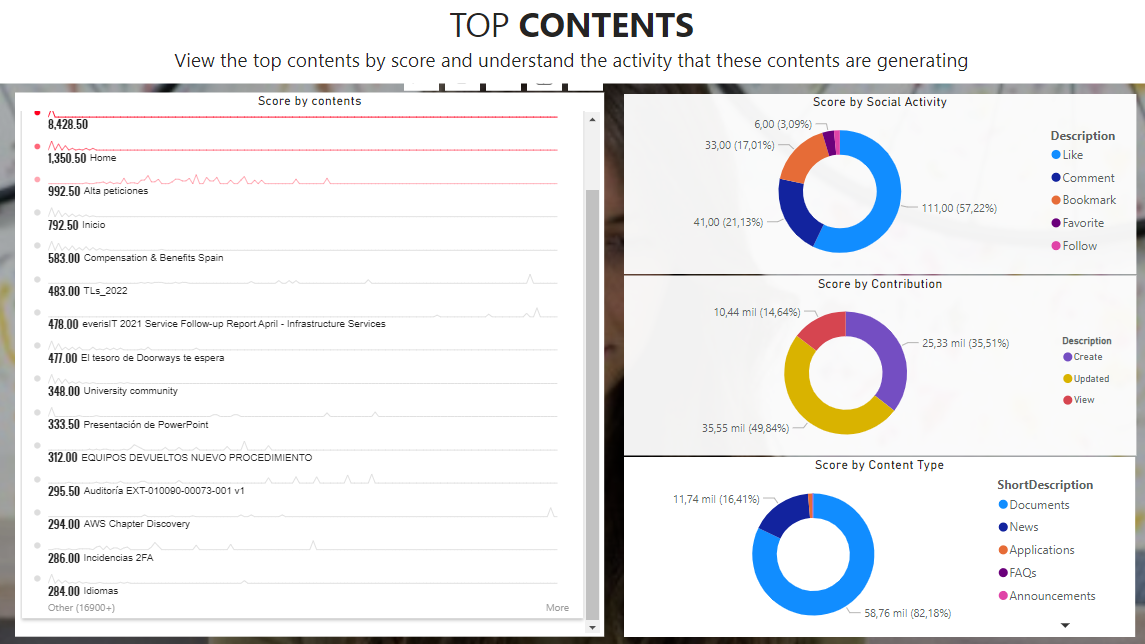
Power BI also allows you to know the most viewed contents and by clicking on them you can obtain information on the activity that these contents are generating.
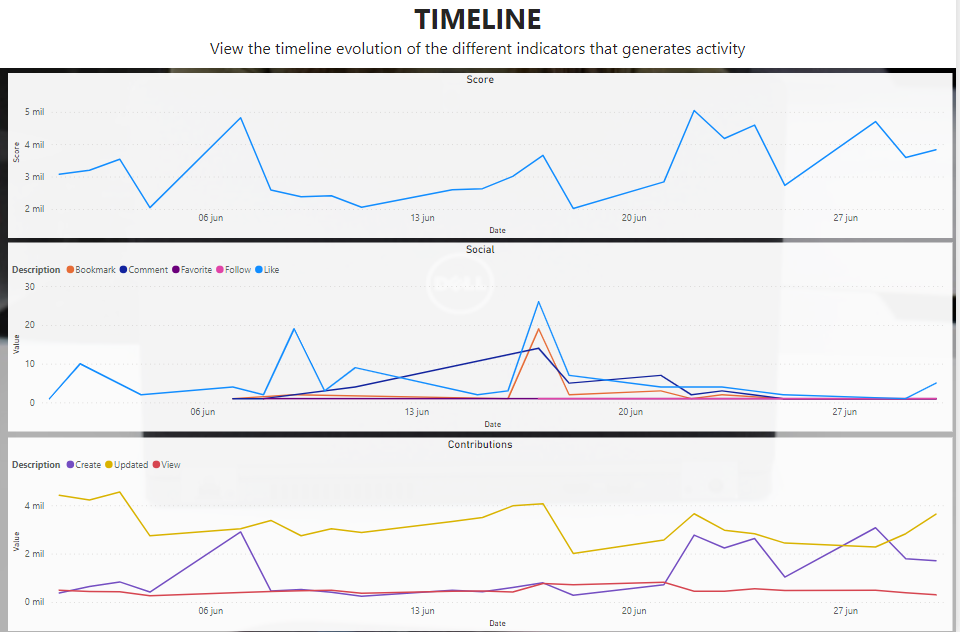
Finally, the timeline shows the evolution over time of the indicators that make up the activity metrics.
Search
The search panel shows what users are interested in using the words they have searched for the most in Syntphony. This data is displayed in two formats, which are a bar chart and a word cloud.
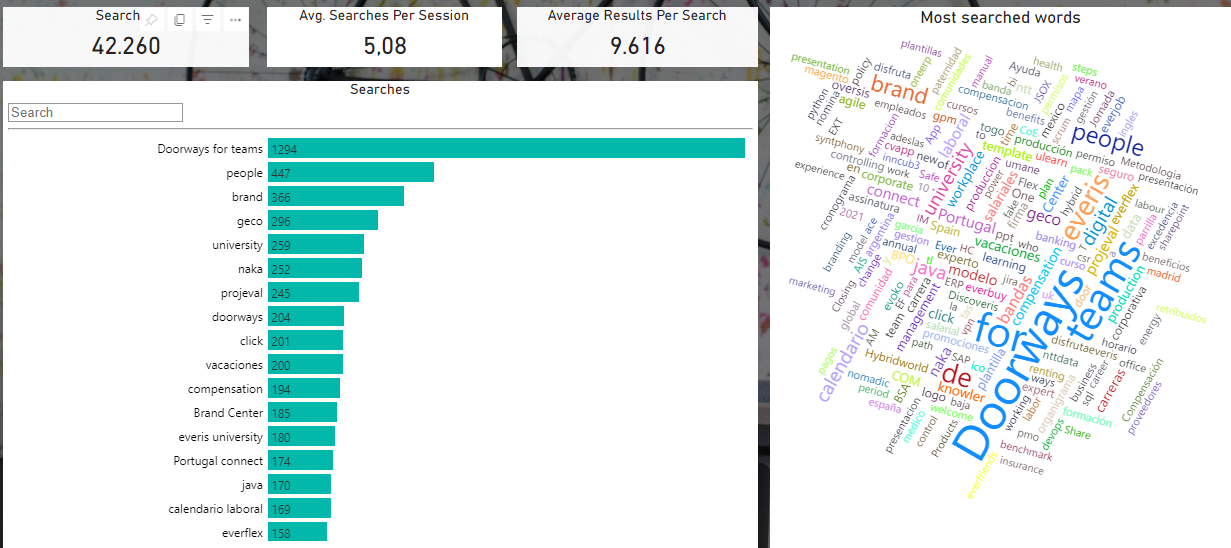
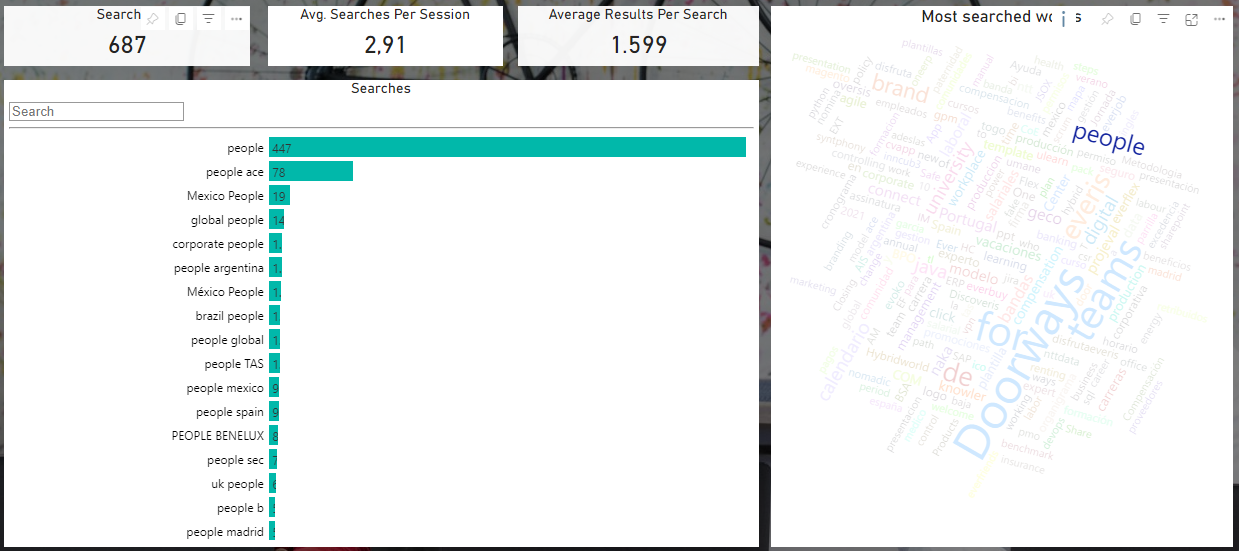
In addition, clicking on a word in the cloud shows you all the ways in which the word itself has been searched.
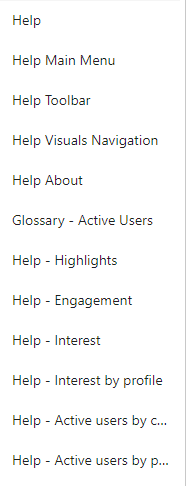
The other menu entries on the Power BI page provide access to help pages with information on the different metrics.
What can be configured in the analytics?
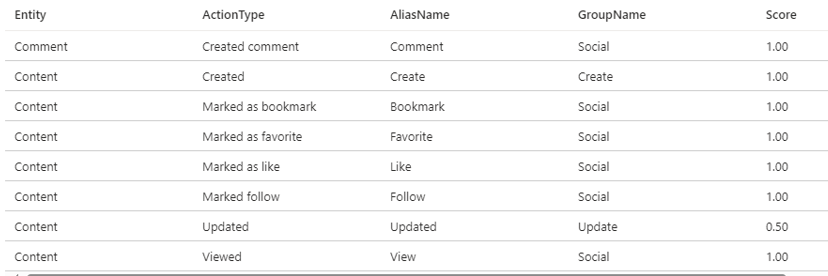
By default there are four metrics configured to parameterise, such as active users, frequency, page depth and session quality, but this can be changed according to the administrator’s needs.
In addition, the administrator can also change the value of each social action, to parameterise the session on target based on its KPIs.